Based on standard metrics, a breathtaking and persistent valuation gap exists between stocks in Japan and China. For the last 10 years (and likely more), Japan has been a perennial deep value market while China has been an overpriced growth market.
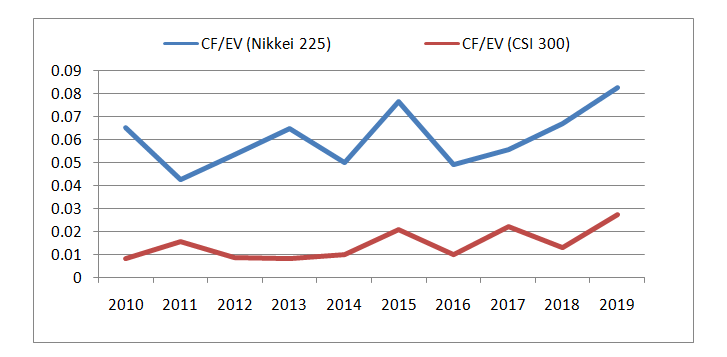
Figure 1: Comparison of the average cash flow to enterprise value (CF/EV) ratio of all stocks in the Nikkei 225 (Japan) and the CSI 300 (China) indexes. Source of underlying data: Bloomberg Finance L.P.
In Figure 1, we see a wide and persistent gap between the average cash flow to enterprise value (“CF/EV”) ratio of all stocks in the Nikkei 225 Index (Japan) versus those of the CSI 300 Index (China). These indexes are representative baskets of large market capitalization stocks in the two countries. As enterprise value is the sum of market capitalization and debt, value stocks tend to have higher CF/EV ratios owing to a lower EV.
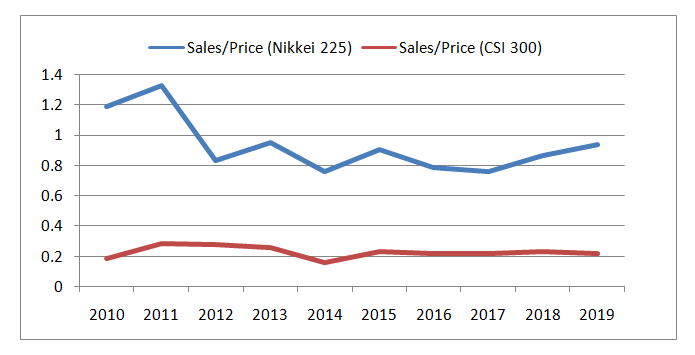
Figure 2: Comparison of the average sales-to-price ratio of all stocks in the Nikkei 225 (Japan) and the CSI 300 (China) indexes. Source of underlying data: Bloomberg Finance L.P.
In Figure 2, we see a wide and persistent gap between the average sales-to-price of all stocks in the Nikkei 225 Index versus those of the CSI 300 Index. Growth stocks tend to have lower sales-to-price ratios because prices are higher as they price in higher sales in the future.
What is the reason for this gap? Of course, overpriced stocks in China are hardly a surprise. But if China has been the quintessential growth story for the past three decades, then what happened in Japan? What collective psychology led to such depressed valuations for such a long time?
If, like me, you stayed in the Tokyo Imperial Hotel in the late 1980s, you would know that once upon a time, Japan had amassed the world’s largest fortune1. It had the world’s largest stock markets in terms of market capitalization, surpassing New York. Its banks were the world’s largest too, clinching nine of the top ten spots.
It was said then that the land beneath the Imperial Palace in Tokyo was worth more than the whole State of California. The market value of the country’s assets, including real estate, exceeded that of the United States.
As the export juggernaut to the world, it became the largest foreign holder of U.S. Treasuries. Punitive tariffs were imposed on its exports to the U.S., leading to prolonged trade tensions.
Clearly, much has changed since the days of “Japan As Number One” 2 and “The Japan That Can Say No” 3. Years of speculation and over-confidence, coupled with easy money and unchecked credit expansion, led to a huge economic bubble that finally burst in the 1990s 4. The collapse precipitated a “Lost Decade” (or two or three) of economic stagnation and deflation that lasted until today.
The impact of the collapse on businesses and households was immense – none more than on the confidence to invest again. One cannot imagine the scale of the collapse until one realizes, for example, that by the early 2000s, property in prime districts in Tokyo had slumped to less than 1% of their peak values but still managed to list as the world’s most expensive at the time.
The Japanese were burned – no, incinerated – and they became extremely conservative. Japan now teems with listed companies with extremely strong balance sheets, stable cash flows and little or no debt – with not much of a market capitalization to show for these admirable characteristics. It is like they keep accumulating cash but are too fearful to spend it.
This is the reason Japan has been such an enduring deep value market.
Indeed, it is an inside joke that if you could transport a Japanese company to China, its market value would triple overnight by virtue of its balance sheet alone. To the savvy entrepreneurs and investors who are able to connect the products and capital resources of Japanese companies to the growth opportunities in China, this is a vast arbitrage opportunity. Practically, it involves adopting an activist approach to investing in Japan, in which management scarred by decades of stagnation and fearful of investing must be prodded into reaching out globally once again 5.
References:
1. Murphy, R.T. “Power Without Purpose: The Crisis of Japan’s Global Financial Dominance”, Harvard Business Review, March-April 1989.
2. Vogel, E.F. “Japan as Number One”, Harvard University Press, 1979
3. Morita, A. and Ishihara, S. “The Japan That Can Say No”, Tokyo: Kobunsha, Kappa-Holmes, 1989
4. Fujii, M and Kawai, M. “Lessons from Japan’s Banking Crisis, 1991-2005”, Asian Development Bank Institute Working Paper Series, No. 222, June 2010
5. Some content in this post was published in a HFM marketing article about Auspicious Capital Management, Hong Kong (disclosure: I work for this company).
The paper by Tanmoy Chakraborty and Michael Kearns, “Market Making and Mean Reversion”, June 2011 (the “CK Paper” and the authors “CK“) purportedly proved that market making is generally profitable on mean reverting time series without requiring additional assumptions about the stochastic price process. Some journalistic websites (such as quantnews.com) referenced this paper as proof that market making is mathematically certain to make money when prices are mean reverting, even if only to a slight degree.
Here I show, using the same basic market-making algorithm in the CK Paper but with a somewhat more realistic model of how markets work, that market making in the manner envisaged by CK is almost always unprofitable. This is so regardless of the mean reversion present in the time series and even when generous assumptions are made regarding the fill rates of the limit orders.
The CK Paper assumes a market exists in which a security can be bought and sold at prices determined exogenously by a single time series , where . A buy (respectively sell) limit order placed in this market at time and price will be filled at the earliest time such that (respectively for sell orders). This means the limit order will be filled once the limit price is touched or penetrated by .
Since prices in reality are quoted in integral multiples of a minimum tick (e.g. one penny for most U.S. stocks or 0.25 for E-mini S&P 500 future contracts), can be assumed to be a positive integer by expressing price in number of ticks. The CK Paper considers the following market-making algorithm: ladders of buy limit orders at and sell limit orders at are placed at time , where the ladder depth is a positive integer chosen such that the price fluctuation shall not exceed for all (this is possible in practice if the time step is small enough). Unfilled orders are canceled and new orders are placed at every time step, which is necessary only if .
CK shows that the following result holds:
Let and . If the above market making algorithm is applied with order size of one share for each buy and sell order, then at time the inventory is , and the profit is .
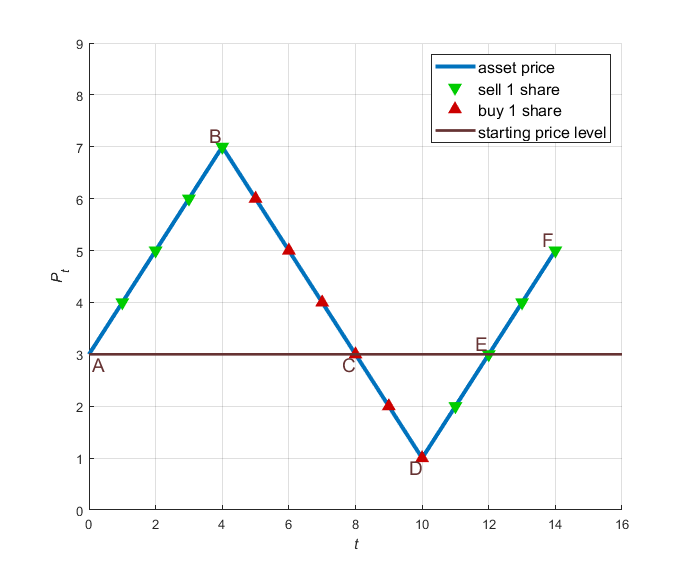
A quick and intuitive proof of the above can be seen from Figure 1, which depicts a fabricated together with trades initiated by the market making algorithm. In the figure, green triangles pointing downwards represent sell trades and red triangles pointing upwards represent buy trades. The algorithm is initiated at A and liquidated at F. One or more sell orders are filled whenever , i.e. whenever an “up tick” occurs; and one or more buy orders are filled whenever , i.e. whenever an “down tick” occurs. The number of orders filled at is , where a negative value means shares were sold. Thus is equal to the total number of orders (equivalently shares) filled. Notice that in any time series segment that returns to the starting price level (such as AC in Figure 1), every sell trade is matched with a buy trade that is one tick lower. Thus, every such matched pair gives a profit of 1 and the total profit is one-half times the total number of up and down ticks in this segment. Accounting for all such segments, there remains trades following the last segment which are unmatched (corresponding to the last two sell trades in segment EF in Figure 1). Thus, the total number of matched trades is and the profit from them is . The unmatched trades are either buy orders filled at if or sell orders filled at if . Assuming they are liquidated at , these correspond to an arithmetic series of losses totaling . Hence the net profit is .
Figure 1: Matched and unmatched trades
Intuitively, if spends a lot of time around its initial price and only goes off a bit at the end, then should be much larger than and therefore the market making profit should be positive. CK formalizes this intuition by proving that the expected profit of the market making algorithm is positive for any biased random walk in which the probability of a positive price change is greater (respectively smaller) if the current price is below (respectively above) a given equilibrium level. CK also shows that for the Ornstein-Unlenbeck process, the expectation grows linearly with while is bounded by a constant, implying that the algorithm will eventually be profitable if it is traded long enough.
Real markets are of course a far cry from the one assumed by CK. Still one would hope the conclusions regarding the profitability of market making would remain largely valid even after accounting for bid/ask spreads, transaction costs, etc. Unfortunately this is not the case as I show using a simple argument below. In fact, it appears that bid/ask spreads exist precisely to defeat the CK type of market making algorithms, rendering them unprofitable for any price time series, mean reverting or not.
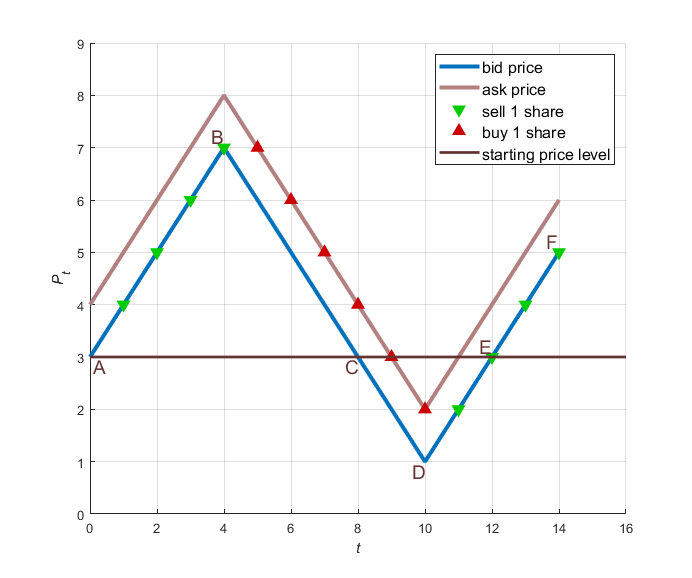
We assume, like CK but more realistically, that prices at which transactions occur are determined exogenously, except now there are two exogenous time series, viz. bid and ask prices. Let and be the bid and ask series respectively. Assume , i.e. the bid/ask spread is constant and equal to 1. At time , the market making algorithm observes and and places a ladder of buy limit orders at and another of sell limit orders at , where is a positive integer chosen such that and for all . Thus the market making algorithm joins the bid and ask at the inside market and brackets it sufficiently on both sides to ensure all price fluctuations are captured. We assume that a buy (respectively sell) limit order placed at time and price will be filled at the earliest time such that (respectively for sell orders). This means the buy order (respectively sell order) will be filled once its limit price is touched or penetrated by the ask price (respectively bid price).
In analogy to Figure 1, we fabricated and in Figure 2 together with trades engendered by the above market making algorithm. In contrast to the CK market, sell orders here are filled only when , i.e. when an “up tick” in the bid occurs; and buy orders are filled only when , i.e. when a “down tick” in the ask occurs. This is a reasonable assumption even in practice since, without additional devices to optimize queue priority, resting bids or asks are rarely filled unless touched or penetrated by the other side. In fact, a common scenario when, say, a sell order is filled is for the bid to rise up to fill it and then fall back immediately, causing a turning point akin to B in Figure 2. Here the sell and buy trades are “scratched”, i.e. executed at the same price in quick succession. Looking at Figure 2, it is apparent the matched trades in all price segments that return to the starting price level have a profit of 0. Thus these segments break even exactly and the net profit of the algorithm is the loss incurred by the trades following the last segment, i.e. where (same as the loss from the unmatched trades in the CK market). Hence the market making algorithm is never profitable.
Figure 2: Matched and unmatched trades in a two-sided market
Since no assumptions have been made regarding the stochastic price process for and , we infer that the bid/ask spread eliminated any possibility of profit for the market making algorithm for any type of time series. To make matters worse, a limit order in reality may not be filled when the opposite side merely touches it unless the fill rate is perfect. For example, a bid rising to become equal to but not greater than the sell limit price may not have sufficient size to fill the order if it is at the back of the queue. Thus there may be losses even in segments which return to the starting price level, implying losses in reality that are greater than those due to the unmatched trades at the end of the time series. Also, going back to Figure 1, we see that the positive profit in the CK market comes entirely from fills at local maxima and minima, e.g. the turning points B and D. In practice, these fills corresponds to limit orders at extrema of the price process getting filled without being touched or penetrated. These are not high probability events in real life unless the orders are at the front of the queue or the bid and ask prices are largely static over time.
To conclude, making markets profitably using the CK laddering algorithm in a two-sided market is impossible regardless of the underlying price process and even if perfect fill rates are assumed. In practice, making markets profitably is extraordinarily difficult and necessarily involve calibrating the algorithm correctly to the price process (e.g. the time and price scale of mean reversion). It must also involve a deliberate policy of not making markets, e.g. canceling all orders, when adverse order flow is detected either from microstructure or excessive inventory on one side.

 , where
  . A buy (respectively sell) limit order placed in this market at time
  and price
  will be filled at the earliest time
  such that
  (respectively
  for sell orders). This means the limit order will be filled once the limit price is touched or penetrated by
  and sell limit orders at
  are placed at time
  is a positive integer chosen such that the price fluctuation
  shall not exceed
  .
. and
and  . If the above market making algorithm is applied with order size of one share for each buy and sell order, then at time
  the inventory is
  , and the profit is
  .
. , i.e. whenever an “up tick” occurs; and one or more buy orders are filled whenever
  , i.e. whenever an “down tick” occurs. The number of orders filled at
  is
is  , where a negative value means shares were sold. Thus
  is equal to the total number of orders (equivalently shares) filled. Notice that in any time series segment that returns to the starting price level (such as AC in Figure 1), every sell trade is matched with a buy trade that is one tick lower. Thus, every such matched pair gives a profit of 1 and the total profit is one-half times the total number of up and down ticks in this segment. Accounting for all such segments, there remains
  trades following the last segment which are unmatched (corresponding to the last two sell trades in segment EF in Figure 1). Thus, the total number of matched trades is
  and the profit from them is
  . The unmatched trades are either buy orders filled at
  if
if  or sell orders filled at
  if
if  . Assuming they are liquidated at
  , these correspond to an arithmetic series of losses
  totaling
  . Hence the net profit is
  .
.
 and only goes off a bit at the end, then
 ![\mathbf{E} [K]](https://michaeltanphd.com/wp-content/ql-cache/quicklatex.com-d4ec261c9e2edc045c7ee357fe74c694_l3.png "Rendered by QuickLaTeX.com") grows linearly with
grows linearly with ![\mathbf{E}[z^2]](https://michaeltanphd.com/wp-content/ql-cache/quicklatex.com-c86c6ea8ba5392b428069560363463ce_l3.png "Rendered by QuickLaTeX.com") is bounded by a constant, implying that the algorithm will eventually be profitable if it is traded long enough.
is bounded by a constant, implying that the algorithm will eventually be profitable if it is traded long enough. and
and  be the bid and ask series respectively. Assume
  , i.e. the bid/ask spread is constant and equal to 1. At time
  and
and  and places a ladder of buy limit orders at
  and another of sell limit orders at
  , where
  and
and  for all
  such that
  (respectively
  for sell orders). This means the buy order (respectively sell order) will be filled once its limit price is touched or penetrated by the ask price (respectively bid price).
 , i.e. when an “up tick” in the bid occurs; and buy orders are filled only when
  , i.e. when a “down tick” in the ask occurs. This is a reasonable assumption even in practice since, without additional devices to optimize queue priority, resting bids or asks are rarely filled unless touched or penetrated by the other side. In fact, a common scenario when, say, a sell order is filled is for the bid to rise up to fill it and then fall back immediately, causing a turning point akin to B in Figure 2. Here the sell and buy trades are “scratched”, i.e. executed at the same price in quick succession. Looking at Figure 2, it is apparent the matched trades in all price segments that return to the starting price level have a profit of 0. Thus these segments break even exactly and the net profit of the algorithm is the loss incurred by the trades following the last segment, i.e.
  where
where  (same as the loss from the unmatched trades in the CK market). Hence the market making algorithm is never profitable.